Your First Options Chain: How to Read It
Your First Options Chain: How to Read It
The options chain is the command center of every options trade. It shows you every available contract for a stock — every strike price, every expiration date, every bid and ask — all in one dense grid of numbers.
The first time you open one, it looks like a Bloomberg terminal designed by someone who hates beginners. Hundreds of rows. Dozens of columns. Green, red, implied volatility percentages.
Here’s the thing: you only need to understand about eight of those columns to execute any trade on this blog. Let’s decode them.
What an Options Chain Shows You
An options chain displays all available options contracts for a specific stock at a specific expiration date. Think of it as a menu: rows list different strike prices, and columns show pricing and statistical data for each contract.
The chain is divided into two sides:
- Left side (Calls): the right to buy shares
- Right side (Puts): the right to sell shares
- Center column (Strike): the price at which the right can be exercised
Here’s a simplified version of what AAPL’s options chain looks like with about 30 days to expiration:
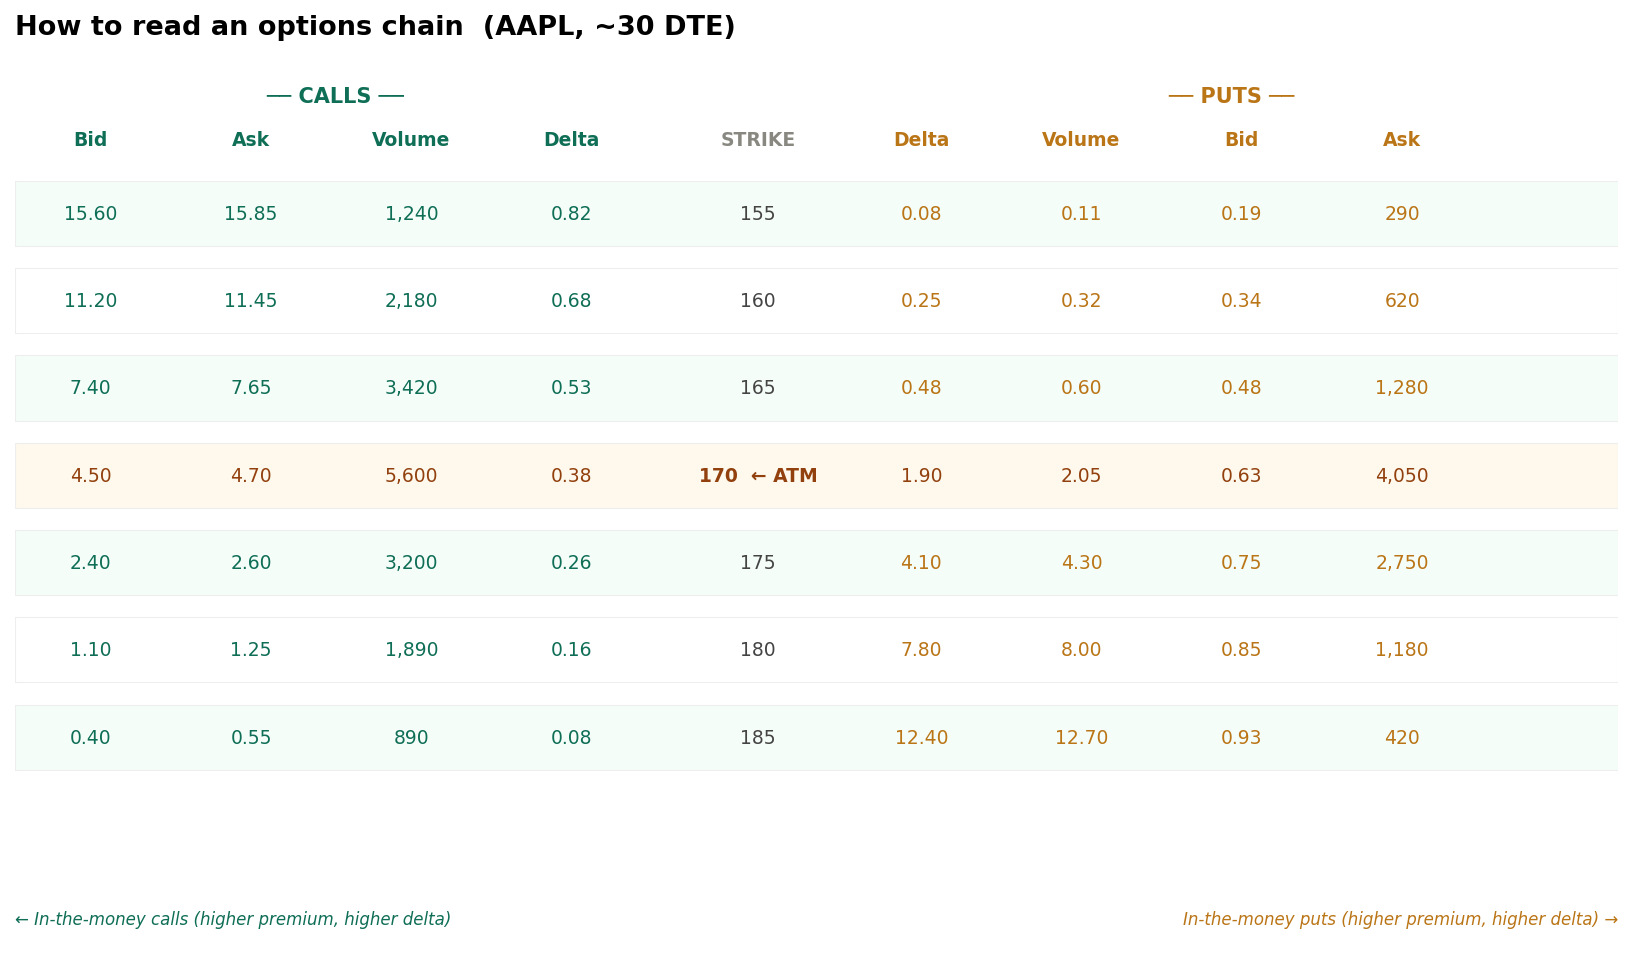 A simplified options chain for AAPL. Calls appear on the left (green), puts on the right (amber), with strike prices in the center. The ATM strike is highlighted.
The Columns You Actually Need
Strike Price (center column)
The strike price is the price at which you can buy (call) or sell (put) the underlying stock. Options are available at many strike prices — typically in $5 increments for most stocks, sometimes $1 or $2.5 for high-priced or volatile stocks.
Bid and Ask
Every options contract has a bid (the highest price a buyer will pay) and an ask (the lowest price a seller will accept). The difference between the two is the spread.
When you buy an option, you pay closer to the ask. When you sell an option, you receive closer to the bid. The spread is the market maker’s cut.
Practical tip: Always look at both bid and ask before placing a trade. Selling a put for $2.05 when the spread is $1.90/$2.05 is fine. But if the spread is $0.50/$2.05, you’re giving up a lot to the market maker. Use a limit order between the bid and ask.
Delta (Δ)
Delta measures how much the option’s price changes for every $1 move in the stock. A delta of 0.38 means the option gains roughly $0.38 for every $1 the stock rises.
Delta also serves as a rough probability: a 0.38-delta call has approximately a 38% chance of expiring in-the-money. We’ll dedicate an entire article to delta — it’s the most important Greek you’ll use for strike selection. See Delta Explained for the full breakdown.
Volume
Volume shows how many contracts have traded today. Higher volume generally means better pricing (tighter spreads) and easier exits. Very low volume means you might struggle to fill your order at a fair price.
In-the-Money (ITM), At-the-Money (ATM), Out-of-the-Money (OTM)
These three terms describe where a strike sits relative to the current stock price:
| Term | For Calls | For Puts | Characteristic |
|---|---|---|---|
| ITM (In-the-money) | Strike < stock price | Strike > stock price | Has intrinsic value; higher premium |
| ATM (At-the-money) | Strike ≈ stock price | Strike ≈ stock price | Highest time value; delta ≈ 0.50 |
| OTM (Out-of-the-money) | Strike > stock price | Strike < stock price | No intrinsic value; cheaper premium |
Most income strategies use OTM options — you collect premium on options that need to move against you before any damage occurs.
Reading the Chain in Practice
Let’s walk through a real example using our AAPL chain with the stock at $170 and 30 days to expiration.
Suppose you want to sell a covered call:
- Look at the calls side (left)
- Find a strike price above $170 — say, $180 (OTM call)
- Check the bid — the $180 call shows a bid of $1.10. That’s the most you’d receive if you sold right now
- Look at the delta — it shows 0.16, meaning there’s roughly a 16% chance AAPL finishes above $180 at expiration. Said differently: an 84% chance you keep the premium
- Check volume — 1,890 contracts traded. Decent liquidity
Suppose you want to sell a cash-secured put:
- Look at the puts side (right)
- Find a strike below $170 — say, $165 (OTM put)
- Check the bid — roughly $1.90. That’s your premium
- Delta shows ~0.35 (absolute value) on the puts side — meaning there’s roughly a 35% chance the stock falls below $165 by expiration (65% chance you keep the premium). Note: some platforms display the same-strike call’s delta in the puts column — if so, subtract from 1.0 to get the put’s ITM probability
- Volume of 4,050 — very liquid
The Expiration Date Selector
Before you see any of the above, you’ll need to select an expiration date. Most brokerages show a dropdown or calendar at the top of the chain — weekly expirations (every Friday for most stocks) and monthly expirations (third Friday of each month).
For income strategies, we target 30–45 days to expiration (DTE) as our sweet spot. You’ll understand why when we cover theta decay.
Common Beginner Mistakes When Reading a Chain
Confusing bid and ask: If you want to sell an option, look at the bid (what buyers will pay you). Don’t get excited by the ask price — you can’t fill at the ask when you’re selling.
Ignoring the spread: A wide spread (e.g., $0.50 bid / $1.20 ask) means poor liquidity. Stick to options with tight spreads and decent volume.
Only looking at premium, ignoring delta: A $5 premium sounds great until you realize the delta is 0.60 — meaning there’s a 60% chance the option goes in-the-money against you. Strike selection is about balancing premium and probability.
Forgetting to multiply by 100: One contract controls 100 shares. A $1.90 option costs $190, not $1.90.
Key Takeaways
- The options chain shows all available contracts for a stock: calls on the left, puts on the right, strikes in the center
- The bid is what you receive when selling; the ask is what you pay when buying — always use limit orders between the two
- Delta is both a pricing sensitivity measure and a rough probability of finishing in-the-money
- ITM options have intrinsic value (higher cost); OTM options are pure time value (cheaper, no intrinsic value)
- Target options with good volume (tighter spreads) and 30–45 days to expiration for income strategies
What’s Next
You can now read an options chain. Time to understand what drives option prices — starting with the most important Greek: Delta Explained: What It Really Means for Your P&L.
Practice reading live options chains on Tastytrade — their options chain layout is designed for active options traders, with live bid/ask, volume, open interest, and Greeks all visible at a glance without having to dig through menus.
Disclosure: this is a referral link. If you sign up via this link, the site may earn a commission at no cost to you.
Disclaimer: This content is for educational and informational purposes only and does not constitute financial, investment, or trading advice. Options trading involves significant risk and is not suitable for all investors. You may lose the entire amount invested. Always conduct your own research and consult a licensed financial advisor before making investment decisions.