Delta Explained: What It Really Means for Your P&L
Delta Explained: What It Really Means for Your P&L
Of all the Greeks, delta is the one you’ll use every single trading day. It tells you how much your option moves when the stock moves. It helps you select strike prices intelligently. And it gives you a rough probability of success on every trade.
Understanding delta deeply — not just the definition but the intuition — is what separates traders who guess at strike selection from traders who set it with precision.
The Simple Definition
Delta (Δ) measures how much an option’s price changes for every $1 move in the underlying stock.
- A call option with a delta of 0.40 gains approximately $0.40 in value for every $1 rise in the stock
- A put option with a delta of −0.40 gains approximately $0.40 in value for every $1 fall in the stock (the negative sign reflects that puts move inversely to the stock)
Since one options contract covers 100 shares, you multiply the delta by 100 to get the actual dollar change:
Delta 0.40 × $1 stock move × 100 shares = $40 gain or loss per contract
Delta as Probability: The Most Useful Interpretation
Here’s the insight that most beginners miss: delta is also a rough approximation of the probability that an option will expire in-the-money.
- A 0.30-delta call has roughly a 30% chance of ending up above the strike at expiration
- A 0.70-delta put has roughly a 70% chance of ending up below the strike at expiration
- A 0.50-delta option is at-the-money — roughly a coin flip
This means when you sell a 0.30-delta call, you’re capturing premium on a trade that has roughly a 70% chance of expiring worthless — which is exactly what you want as a seller.
Most professional options sellers target the 0.20–0.35 delta range for selling (the “30-delta” strike is an industry standard). It offers a balance between meaningful premium and favorable probability.
How Delta Changes with Stock Price
Delta is not fixed. It shifts continuously as the stock price moves. This relationship is captured in a characteristic S-curve:
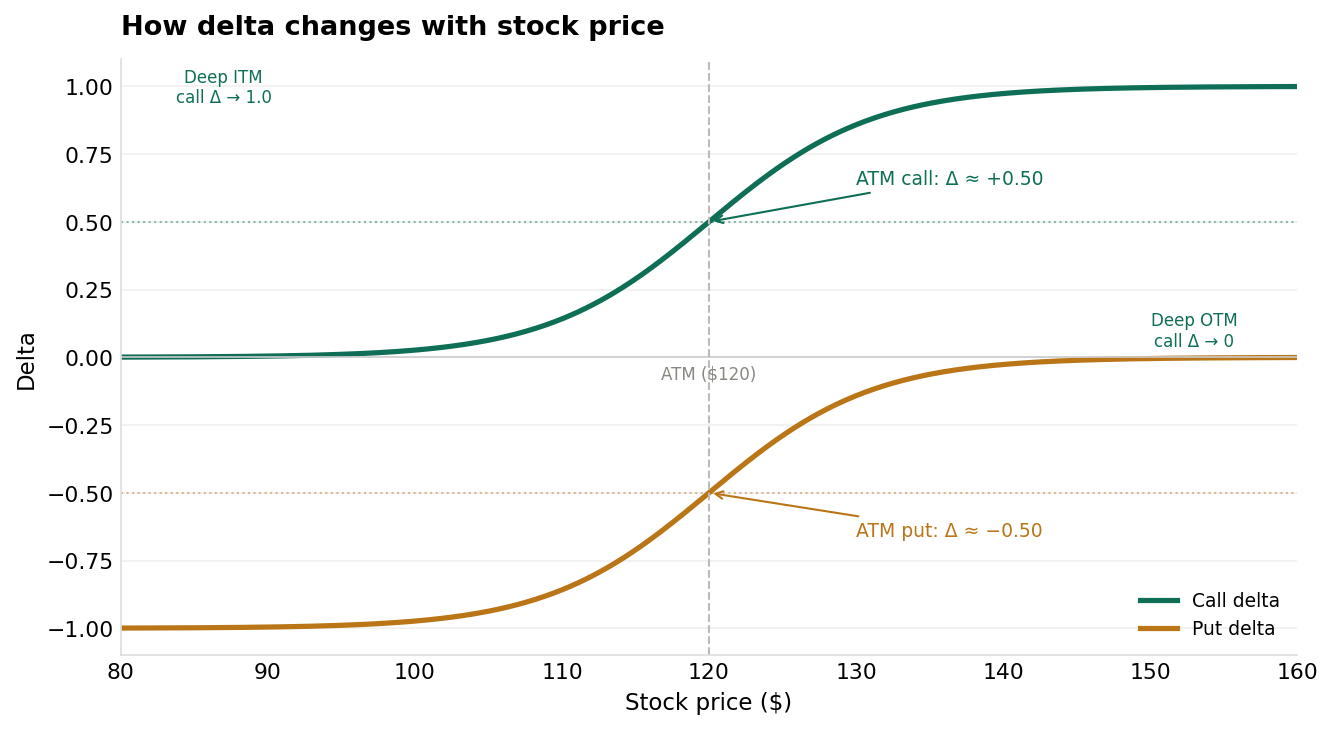 Call delta (teal) rises from 0 to 1 as stock price increases through and above the strike. Put delta (amber) runs from 0 to −1 as stock price falls. Both cross approximately ±0.50 at the ATM strike.
Key observations from the chart:
Deep in-the-money (ITM): Call delta approaches 1.0 — the option moves almost dollar-for-dollar with the stock. At this point, holding the option is nearly equivalent to owning the stock.
At-the-money (ATM): Delta is approximately 0.50 for calls and −0.50 for puts. This is the maximum time value zone — the point of maximum uncertainty about which way the stock will finish.
Deep out-of-the-money (OTM): Delta approaches 0 — small stock moves have little effect on the option’s value. These are lottery tickets: cheap, but rarely pay off.
Delta and the Rate of Change: Meet Gamma
If delta tells you how much the option moves, gamma tells you how fast delta itself changes as the stock moves.
Gamma is highest for at-the-money options and increases as expiration approaches. This is why short-dated ATM options can explode in value with even small stock moves — their delta is changing rapidly.
For income sellers, this is a risk to understand: a short OTM option sold 45 days out has low gamma (slow delta change). That same option with 3 days left and the stock approaching the strike has very high gamma — small moves can cause large P&L swings. This is why the mantra “manage positions before expiration” exists.
Using Delta to Select Strike Prices
Here’s a practical framework you can apply immediately:
| Strategy | Target Delta | Why |
|---|---|---|
| Covered call | 0.20–0.30 Δ | OTM, ~75–80% chance of expiring worthless |
| Cash-secured put | 0.25–0.35 Δ | OTM with meaningful premium, ~65–75% probability of success |
| Short strangle | 0.15–0.20 Δ each side | Wide OTM strikes, high probability of staying within the range |
| Long directional call | 0.40–0.60 Δ | Near ATM for leverage with real sensitivity |
| Protective put (hedge) | 0.20–0.30 Δ | OTM insurance; cheap but effective protection |
The 30-delta strike is a widely-used benchmark because it sits in a sweet spot: enough premium to be worth collecting, and a high enough probability of success to make the trade worthwhile over many repetitions.
A Real Example: AAPL at $170
Suppose AAPL is trading at $170 and you want to sell a covered call:
- The $175 call (OTM by $5) has a delta of approximately 0.35 and a premium of $3.50
- The $180 call (OTM by $10) has a delta of approximately 0.16 and a premium of $1.10
- The $185 call (OTM by $15) has a delta of approximately 0.08 and a premium of $0.45
The $175 call offers more premium but a higher probability of getting called away ($3.50 vs $1.10). The $185 call is safer but barely worth the commission friction.
The $180 call sits in the middle: ~84% probability of keeping the premium, $110 per contract in income, and a buffer of $10 before you start giving up stock gains.
Most traders would consider the $180 call the balanced choice here.
The Key Numbers to Remember
- Delta 0.50 = at-the-money; 50/50 probability; maximum time value
- Delta 0.20–0.35 = sweet spot for selling premium (OTM, favorable probability)
- Delta near 1.0 = deep ITM call; moves like owning stock
- Delta near 0 = deep OTM; lottery ticket territory
- Puts have negative delta (−0.20 to −0.50 are common selling targets)
Key Takeaways
- Delta measures the option’s price change per $1 move in the stock, scaled by 100 shares per contract
- Delta also approximates the probability of expiring in-the-money — a 0.30-delta option has roughly a 30% chance of finishing ITM
- Delta ranges from 0 to 1 for calls and 0 to −1 for puts; ATM options have delta ≈ ±0.50
- For income selling, target the 0.20–0.35 delta range — meaningful premium with favorable probability
- Gamma measures how fast delta changes; it matters most near expiration or ATM
What’s Next
Delta tells you where to sell. Theta Decay: The Options Seller’s Best Friend explains why time works in your favor when you’re the one collecting premium — and why the 30–45 DTE window is the sweet spot for income trades.
To see delta, gamma, and the full Greeks in real time on a platform built for options sellers, check out Tastytrade — their options chain displays delta prominently and makes it easy to target the 0.20–0.35 delta range directly from the chain view.
Disclosure: this is a referral link. If you sign up via this link, the site may earn a commission at no cost to you.
Disclaimer: This content is for educational and informational purposes only and does not constitute financial, investment, or trading advice. Options trading involves significant risk and is not suitable for all investors. You may lose the entire amount invested. Always conduct your own research and consult a licensed financial advisor before making investment decisions.